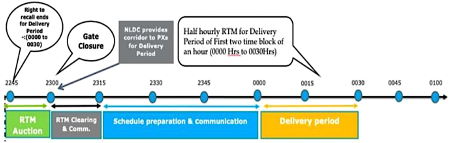
India’s real-time market (RTM), launched on June 1st, 2020 on both the power exchanges after two years of public consultations by the Central Electricity Regulatory Commission (CERC). The RTM is a centralized market platform which runs a double-sided closed auction, closer to delivery. The market runs every 30 minutes, i.e., 48 times a day. The timeline below shows the process from auction to delivery.
The two primary objectives of RTM were to:
- Optimize the utilization of existing resources to cater to real-time imbalances through a centralized platform, and
- Facilitate integration of large-scale renewable energy through larger balancing areas and faster markets.
The RTM has been running successfully for a month now, and the response has been extremely positive with India Energy Exchange (IEX) reporting 237 participants in the first month. Participants have also expressed how the RTM is helping them manage their imbalances in a cost-effective manner. In this blog, I look at early trends and patterns that can be observed from the price and volume data of the RTM from IEX for June 2020. Starting with daily averages, I’ll break down the data into diurnal, regional and area wise trends.
Chart 1 shows the daily average market clearing price (MCP) and scheduled volume. The abnormally low volumes and prices cleared in several time blocks during the first few days could have skewed the results, but we observe the volume growing in subsequent days. The last 10 days of the month saw average volumes above 1,000 megawatts (MWs). Just like in any other market, participants experiment with different strategies and learn from historic data that is generated along the way. Given that the RTM is primarily designed for imbalance management, we can expect the volume to be between 2,000 MW and 4,000 MW in any time block. So, it’s encouraging to see the average volume already going above 1,000 MWs.
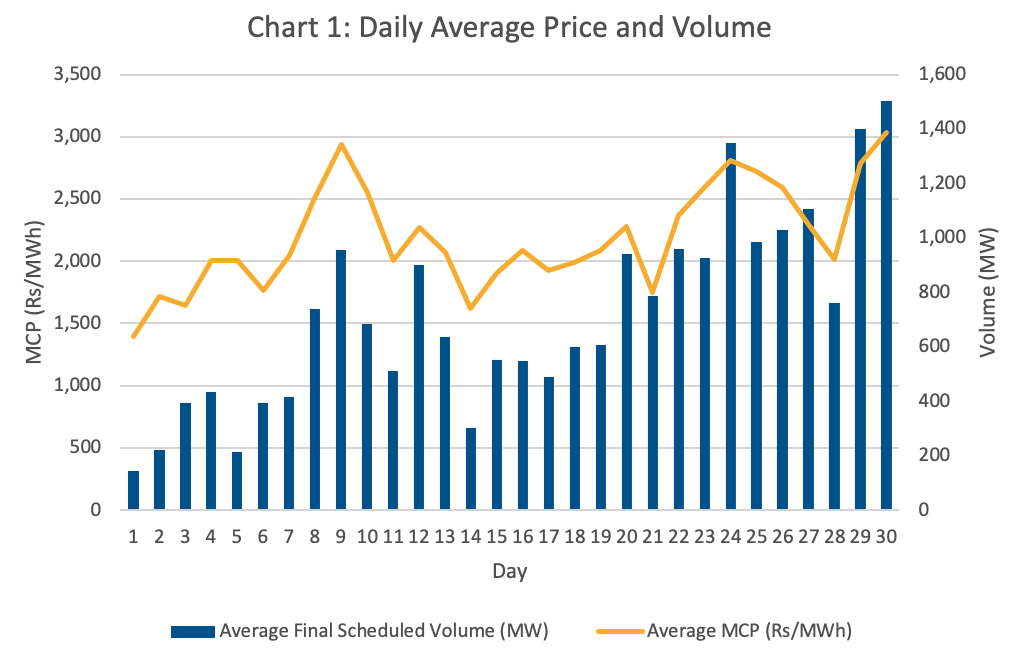
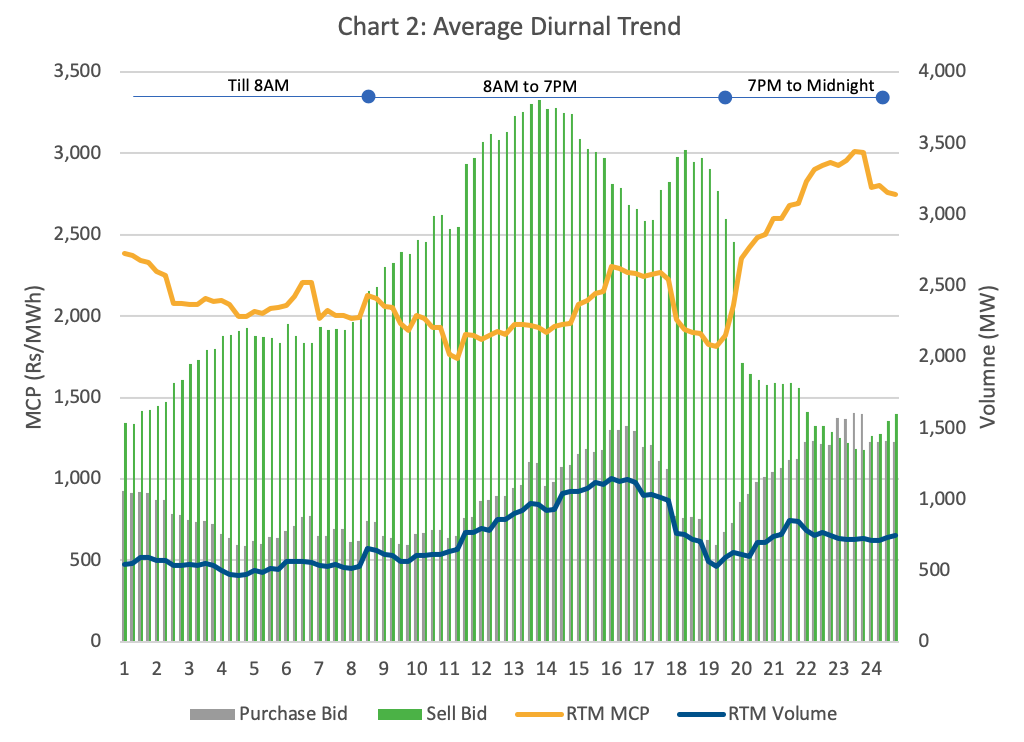
Chart 2 shows the average diurnal price and scheduled volume as well as the demand-supply for the month. As expected, the average supply is higher than the demand in almost all time‑blocks, a reality emerging from the capacity surplus in India’s power system coupled with lower demand due to reduced economic activity during this period. The MCP is therefore seen to be following the demand closely. The supply trend is also consistent with solar generation hours and peaks during early afternoon. The supply first declines with the solar generation tapering off; however, a big drop is observed later from around 6.30 pm to 7.00 pm. This could be due to evening ramp-up, combined with the increase in net load to be served, which reduces the availability of dispatchable generators. The average MCP has hovered between ₹ 1,800-2,400/MWh from midnight until around 7.00 pm, after which the drop in supply and rise in demand simultaneously lead to a higher MCP. It will be interesting to observe the results in the coming months as wind generation picks up.
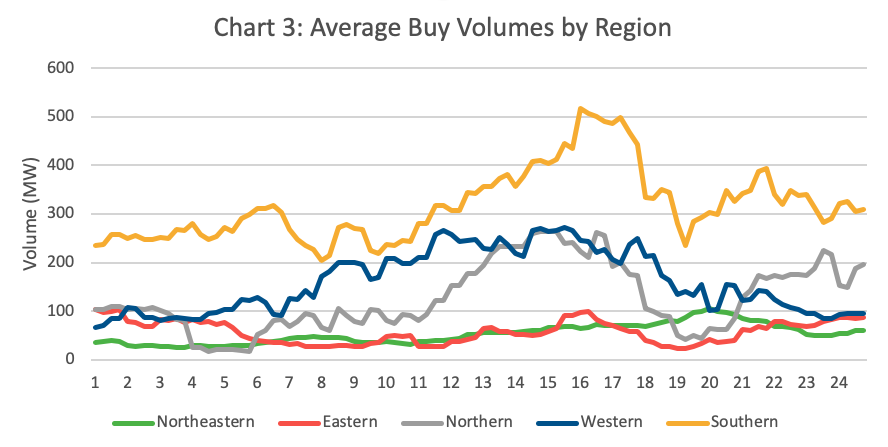
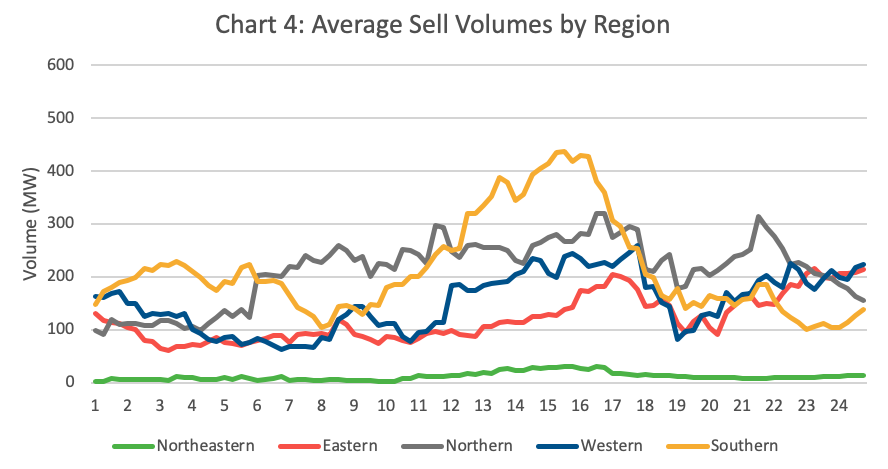
Moving onto regional trends, Charts 3 & 4 show us the average diurnal regional demand and supply for the month. The southern region has clearly dominated the volume of buy bids in all time blocks, with around a 50% share in many hours. Supply is more scattered, with the southern and northern region alternatively dominating every few hours.
One of the biggest arguments for larger balancing areas is to take advantage of diversity in generation and load patterns between different regions. This can be observed here, specifically during a few hours. The northern region has higher supply during the morning peak hours while their demand remains relatively low. This benefits the western and southern regions, catering to their increasing demand in the morning. The demand in the southern region rises after 7.00 pm again while their supply drops drastically. This is complemented by the rise in supply from the northern, eastern and western regions. The overall sell volume of the eastern region has largely remained well above their demand, allowing them an opportunity to sell their generation to a region with higher demand. One can observe many such instances if the data is deaveraged and looked at more granularly.
Distribution companies also have an opportunity to undertake trading activity by selling surplus generation in their portfolio themselves. Currently, the generator has to share the profits with the beneficiary if any surplus contracted power is sold in the RTM. However, if the distribution company itself sells the power, then it enjoys all the profits.
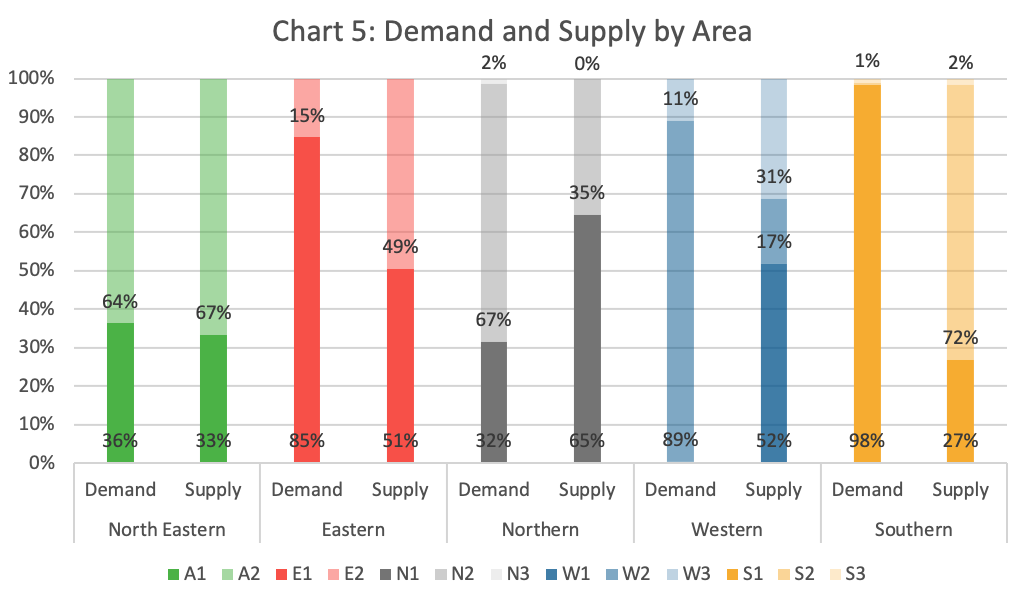
The trends become even more interesting when we look at the individual bid areas in each region. Chart 5 shows the demand and supply of 12 bid areas in the five regions. We can observe straightaway that apart from the northeastern region, all other regions have diversity in demand and supply amongst different areas. Starting with the southern region, which had the highest demand bids in all time blocks, 98% came from area S1 i.e., Karnataka, Andhra Pradesh and Telangana primarily. The other two bid areas hardly placed any demand bids, let alone got cleared. On the other hand, 72% of the supply bids came from S2, which is Tamil Nadu and Pondicherry.
In the western region, W2 i.e., Maharashtra, Gujarat, and North Goa, dominated the demand with an almost 90% share. From the supply side, W1 & W3, i.e. Madhya Pradesh and Chhattisgarh respectively, which have low-cost solar as well as thermal plants closer to coal mines, placed 70% of supply bids. Similarly, we see N2 and N1 dominating the demand and supply respectively, while N3 i.e., the state of Punjab, has almost negligible participation in the month of June. In the eastern region, E1, which includes the states of West Bengal, Sikkim and Bihar and Jharkhand, had 85% of the demand bids; one of the reasons could be simply because E2 only consists of Odisha. However, E2 alone contributed to almost 50% of the supply. Although not equal, the share of demand and supply from the two areas in the northeastern region is consistent on average.
This visibility is a direct result of a common marketplace, which allows everyone to transact in the most economically efficient manner while providing the system operator more control over the resources post gate closure. It would not be possible for buyers and sellers to have so much information in real-time without such a platform. The benefits of regional diversity were also experienced in the security constrained economic dispatch (SCED) pilot; however, the RTM goes a step beyond and puts a fair value on the power transacted.
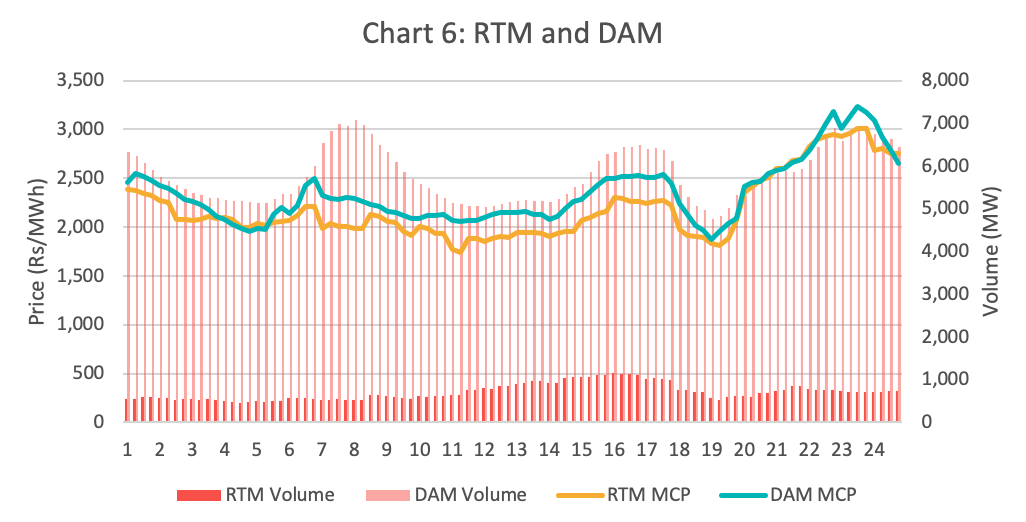
Lastly, Chart 6 compares the average diurnal RTM and Day Ahead Market (DAM) prices in IEX. The trend of both of these prices is similar, with RTM prices lower than DAM in most of the time blocks on average. In the long run, as the market matures, the arbitrage between the DAM and RTM should reduce and therefore the volume of the RTM should grow to the extent that it is cheaper to procure power from the RTM than schedule day-ahead. Although, more than 90% of all wholesale market transactions take place bilaterally, we are witnessing distribution companies revamp their power procurement strategies and optimize between buying from their own portfolio of contracted generators and from the power exchanges. This would increase the buy-side liquidity in both the markets and create strong price signals for others as well.
These high-level observations help us, to some extent, understand the diversity of participation and how buyers and sellers in different areas can take advantage of different scenarios. The intent of this article is to highlight some of my observations based on the price‑volume data alone. The market has only been running for a little over a month and, therefore, there’s a long way to go and a lot more data to be analyzed. A few interesting questions to explore would be the impact of the RTM on renewable energy curtailments and whether distribution companies are able to sell excess generation in the market instead of ramping power plants. Are we observing reduced dependency on deviation settlement mechanism after the launch of the RTM? Has the RTM benefitted merchant generators in any way? How would RTM affect the role and potential of SCED optimization? I’m sure we will come up with many more questions and insights as the market matures. I look forward to hearing from the multiple stakeholders in the power sector community to better understand the explicit as well as implicit impacts that we experience from these wholesale market reforms.
Banner photo by Aniket Bhattacharya on Unsplash