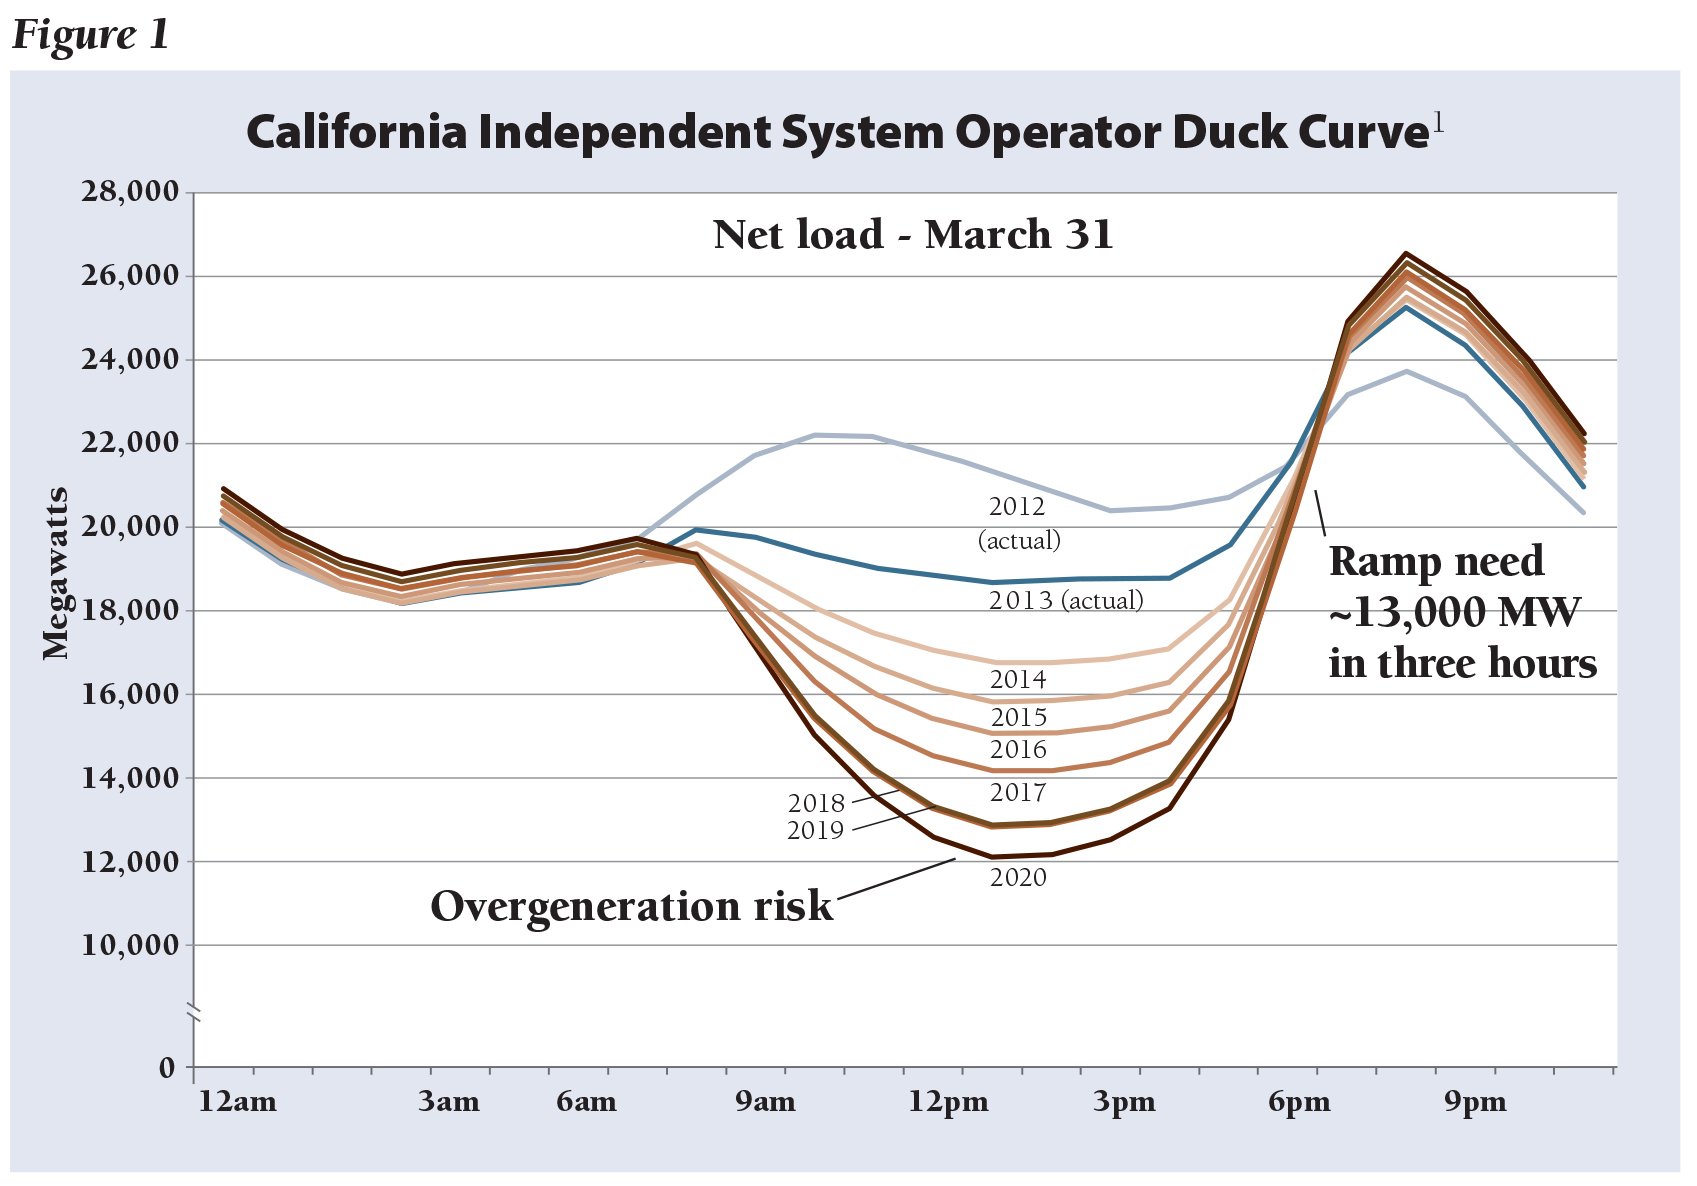
 Utilities and grid operators from Germany to Hawaii have expressed concern about their ability to maintain reliable service as increasing amounts of variable renewable energy–primarily wind and solar–are added to a grid that has historically consisted overwhelmingly of “dispatchable” resources such as coal, natural gas, and hydropower units. This has been described in many ways, with the California ISO portraying this as a “Duck Curve” comparing the “gross system load” of customer consumption to the “net system load” after deducting the amounts expected to be provided by non-dispatchable resources.
Regardless of how you feel about a particular species of waterfowl, if you are active in the power sector, you likely have an awareness of the “Duck Curve.”
If you work in solar power, the duck curve is proof of your growing industry’s ability to meet early afternoon peak power demand. If you work in efficiency, storage, or demand response, the curve is an opportunity to prove your value during fast-ramping periods in the late afternoon. If you work in a utility or regulatory agency, the duck is a triple challenge—straining your grid, threatening profits, and challenging old system control and management models.
The duck curve isn’t news to anyone active in the power sector. But, over the last several years, we have learned a lot about how to address it while maintaining system reliability, affordability, and environmental performance.
Utilities have begun testing a raft of strategies that push up on the duck’s belly, and flatten the steepness of its neck. Markets are rewarding flexible loads and flexible generation, and new technologies are being deployed as the economic rewards become more compelling.
Techniques to Beat the Duck Curve
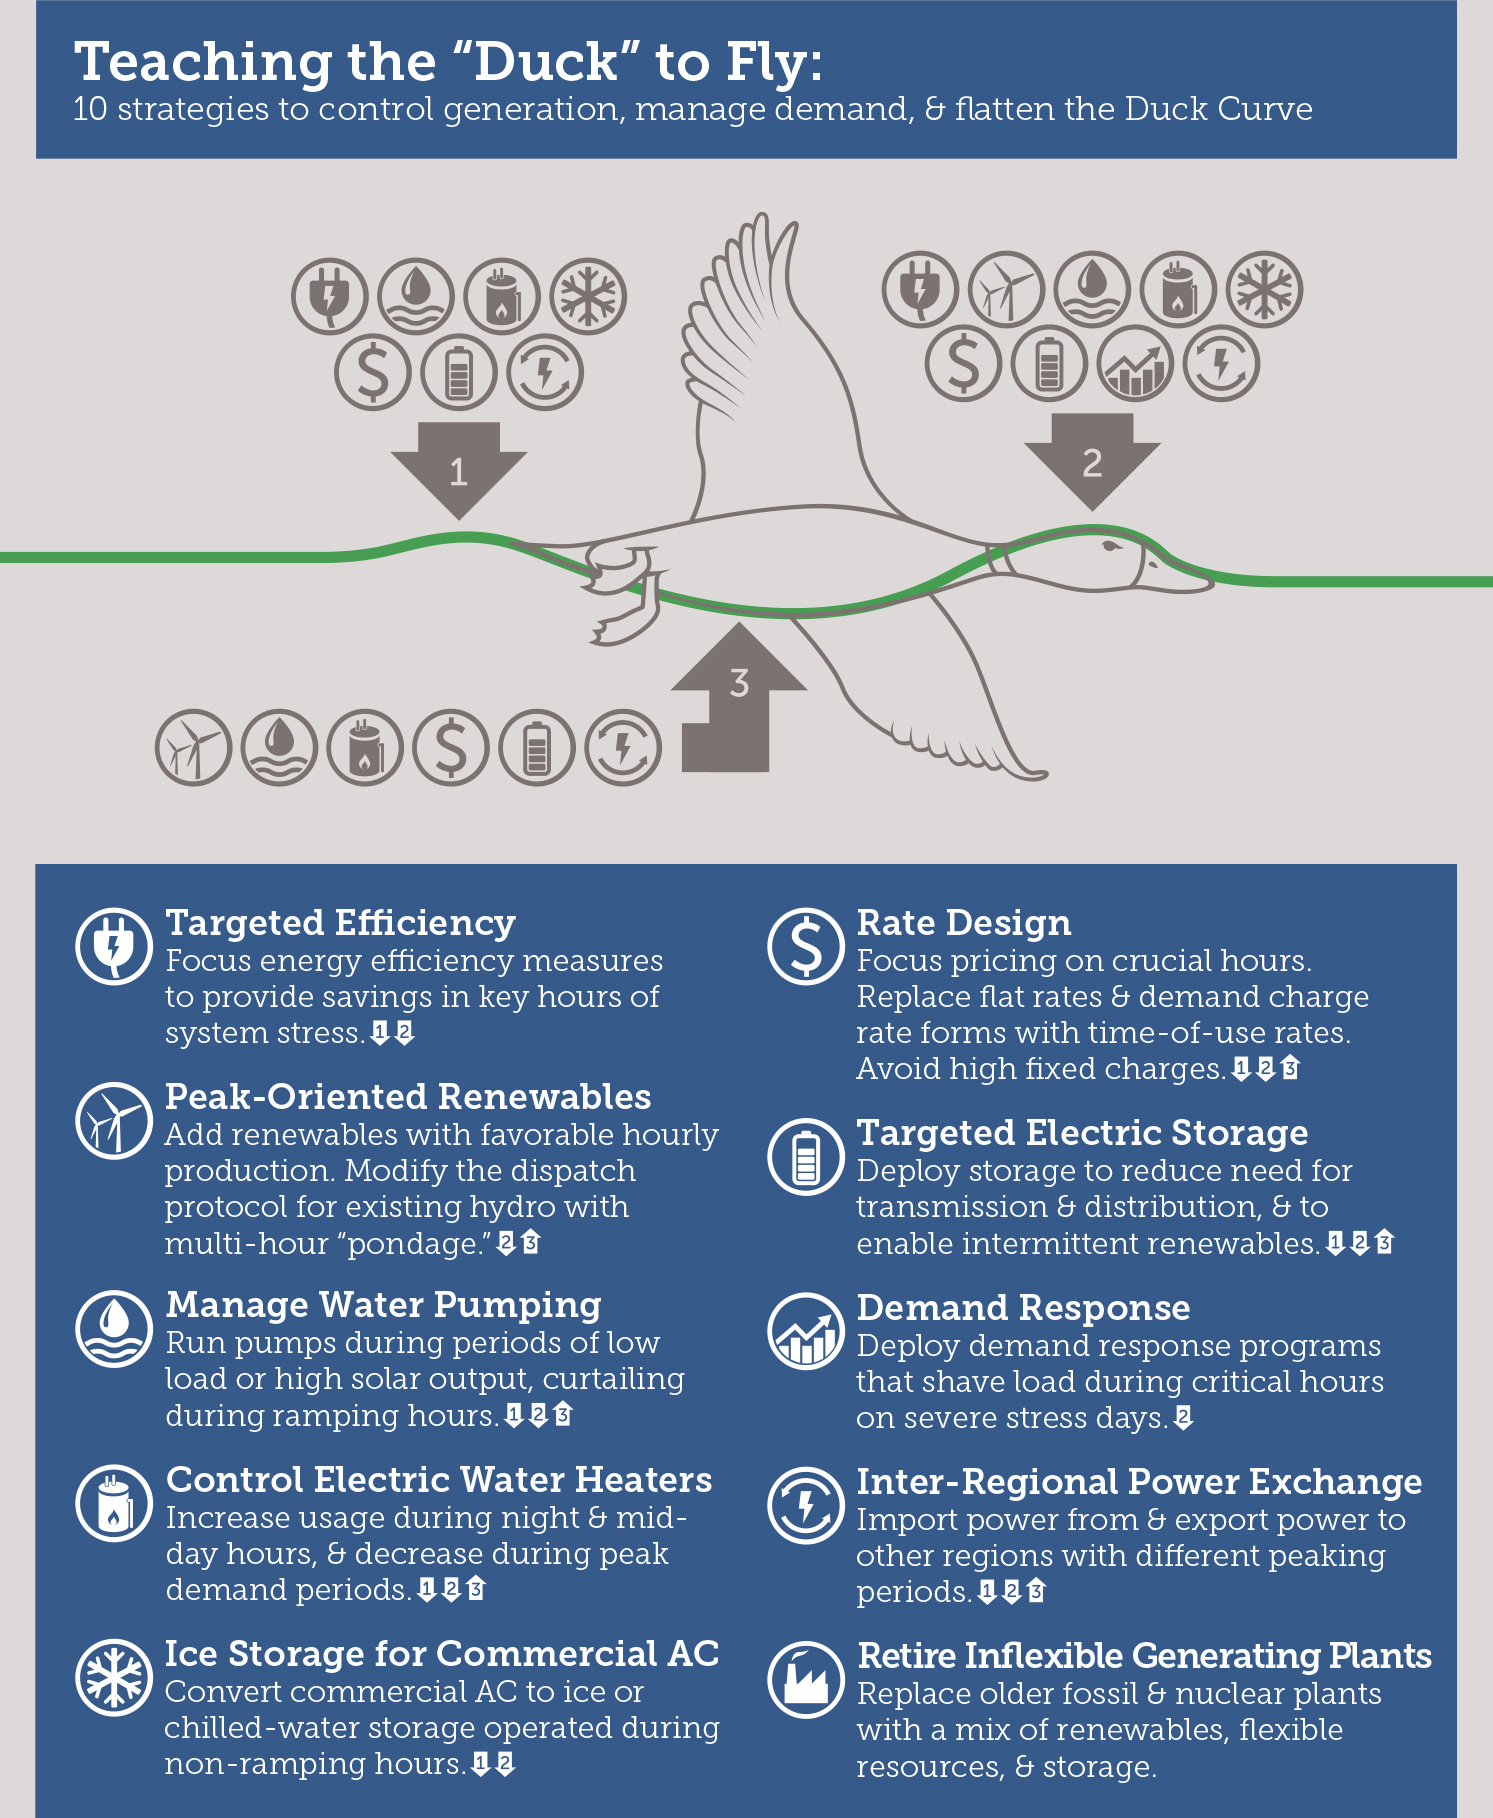
At the Regulatory Assistance Project, we’ve identified ten strategies, all of which are proven in the marketplace, that are beginning to re-shape the Duck Curve – and point toward a future in which our electric system is cleaner, more dynamic, and more capable of integrating new technologies and grid management practices.
While many of these strategies will be familiar, two stand out as they represent new “lessons learned” from the past several years of experience dealing with the Duck Curve—the value of peak-oriented renewables, and the use of water as a battery.
Peak-Oriented Renewable Energy is the Most Valuable
Many states have renewable portfolio standards that set baseline minimums for renewable energy penetration, but don’t require consideration of when such assets are producing their maximum power. By targeting their acquisition of renewables to those projects that offer the most well-timed production—in particular, afternoon or evening-peaking wind—utilities and grid managers can shave significant load off the duck’s neck. In particular, existing hydro resources that have historically been scheduled to meet a predictable load can be more actively managed to adapt to a more variable net load. Other options include orienting solar panels to face west, which produces useful output up to two hours longer in the evening when the most serious ramping challenges occur, and siting wind facilities in places with favorable afternoon production patterns.
Water is a Battery, and we Should Use it that Way
The water/energy interconnection is extensive. In addition to hydropower, water is already used as a battery in many parts of the world to store potential energy, heat, or cold for later use in various applications. There are three ways utilities can put water to use in service of the duck, and save themselves the need for new generation assets:
- Water and wastewater pumping consume 7 percent of all electricity in the U.S., but such pumping is usually not coordinated as a part of efforts to manage load and shift peak demand. By offering incentive pricing to large water managers, such as water and sewer districts, utilities can turn these assets into a form of “reverse battery,” scheduling pumping demand for periods of high renewable energy production—such as the solar daytime peak or wind’s typical nighttime peak. Rate design changes are needed to reward water and wastewater utilities that modify their utilization.
- The ability to load-shift demand for air conditioning through the production and storage of ice and chilled water is substantial, and offers a pathway to significantly shift peak AC load away from the late afternoon peak toward periods of high renewable production. There are some very large and successful examples of this, most notably a district cooling system with ice storage operated by Austin Energy to manage peak load. Some large and high-rise commercial buildings, such as Rockefeller Center and the Bank of America buildings in New York City, already deploy ice and chilled-water storage, but fewer than 1 percent of U.S. air conditioning systems have any thermal storage.
- Similarly, controlling water heaters to ensure they switch on during periods of high daytime solar production or high nighttime wind production offers the opportunity to integrate up to 100,000 additional megawatts of solar and wind energy in the U.S. grid. Switching them off during peak load periods avoids the need for expensive peaking generation, and customers can still use the stored hot water for showers and laundry. Great River Energy, a cooperative utility in Minnesota, already stores 1 GWh of energy each night by controlling it’s members the 65,000 electric resistance water heaters. A new Brattle study confirms the potential to use water heaters as batteries—it found that advanced water heaters can save $50 to nearly $200 annually each in avoided utility system costs, and reduce greenhouse gas emissions associated with heating water by 30 to 50 percent.
These resources alone offer immense potential–providing system flexibility similar to battery storage at a fraction of the current (rapidly declining) cost of utility-scale battery storage systems.
Other Duck Curve Strategies
In addition to the above insights about renewables and water storage, we’ve also learned that some resources are less valuable than previous assessments suggested. West-facing solar panels do produce a more valuable output, but the incremental value turns out to be relatively small. Solar/thermal power plants do allow for delayed generation into the evening, but remain expensive while the cost of PV solar has declined dramatically.
The rest of the ten strategies are already in use on a modest scale, and others have been proven in pilot programs, but none require new technology. While these strategies involve commercially available technologies, the technologies—at least to date—have not been aggressively deployed. But they demonstrate how loads can be adapted to variable renewable energy resources to assure reliable and economical service to consumers.
The Duck in Flight
The end result is a more flexible power system, with greater control over loads, including the ability to shape loads on a minute-to-minute basis to improve reliability, and through the day to adapt to a new fleet of low-carbon generating resources. The graphic below compares the pre-strategy load to the result of implementing these strategies.
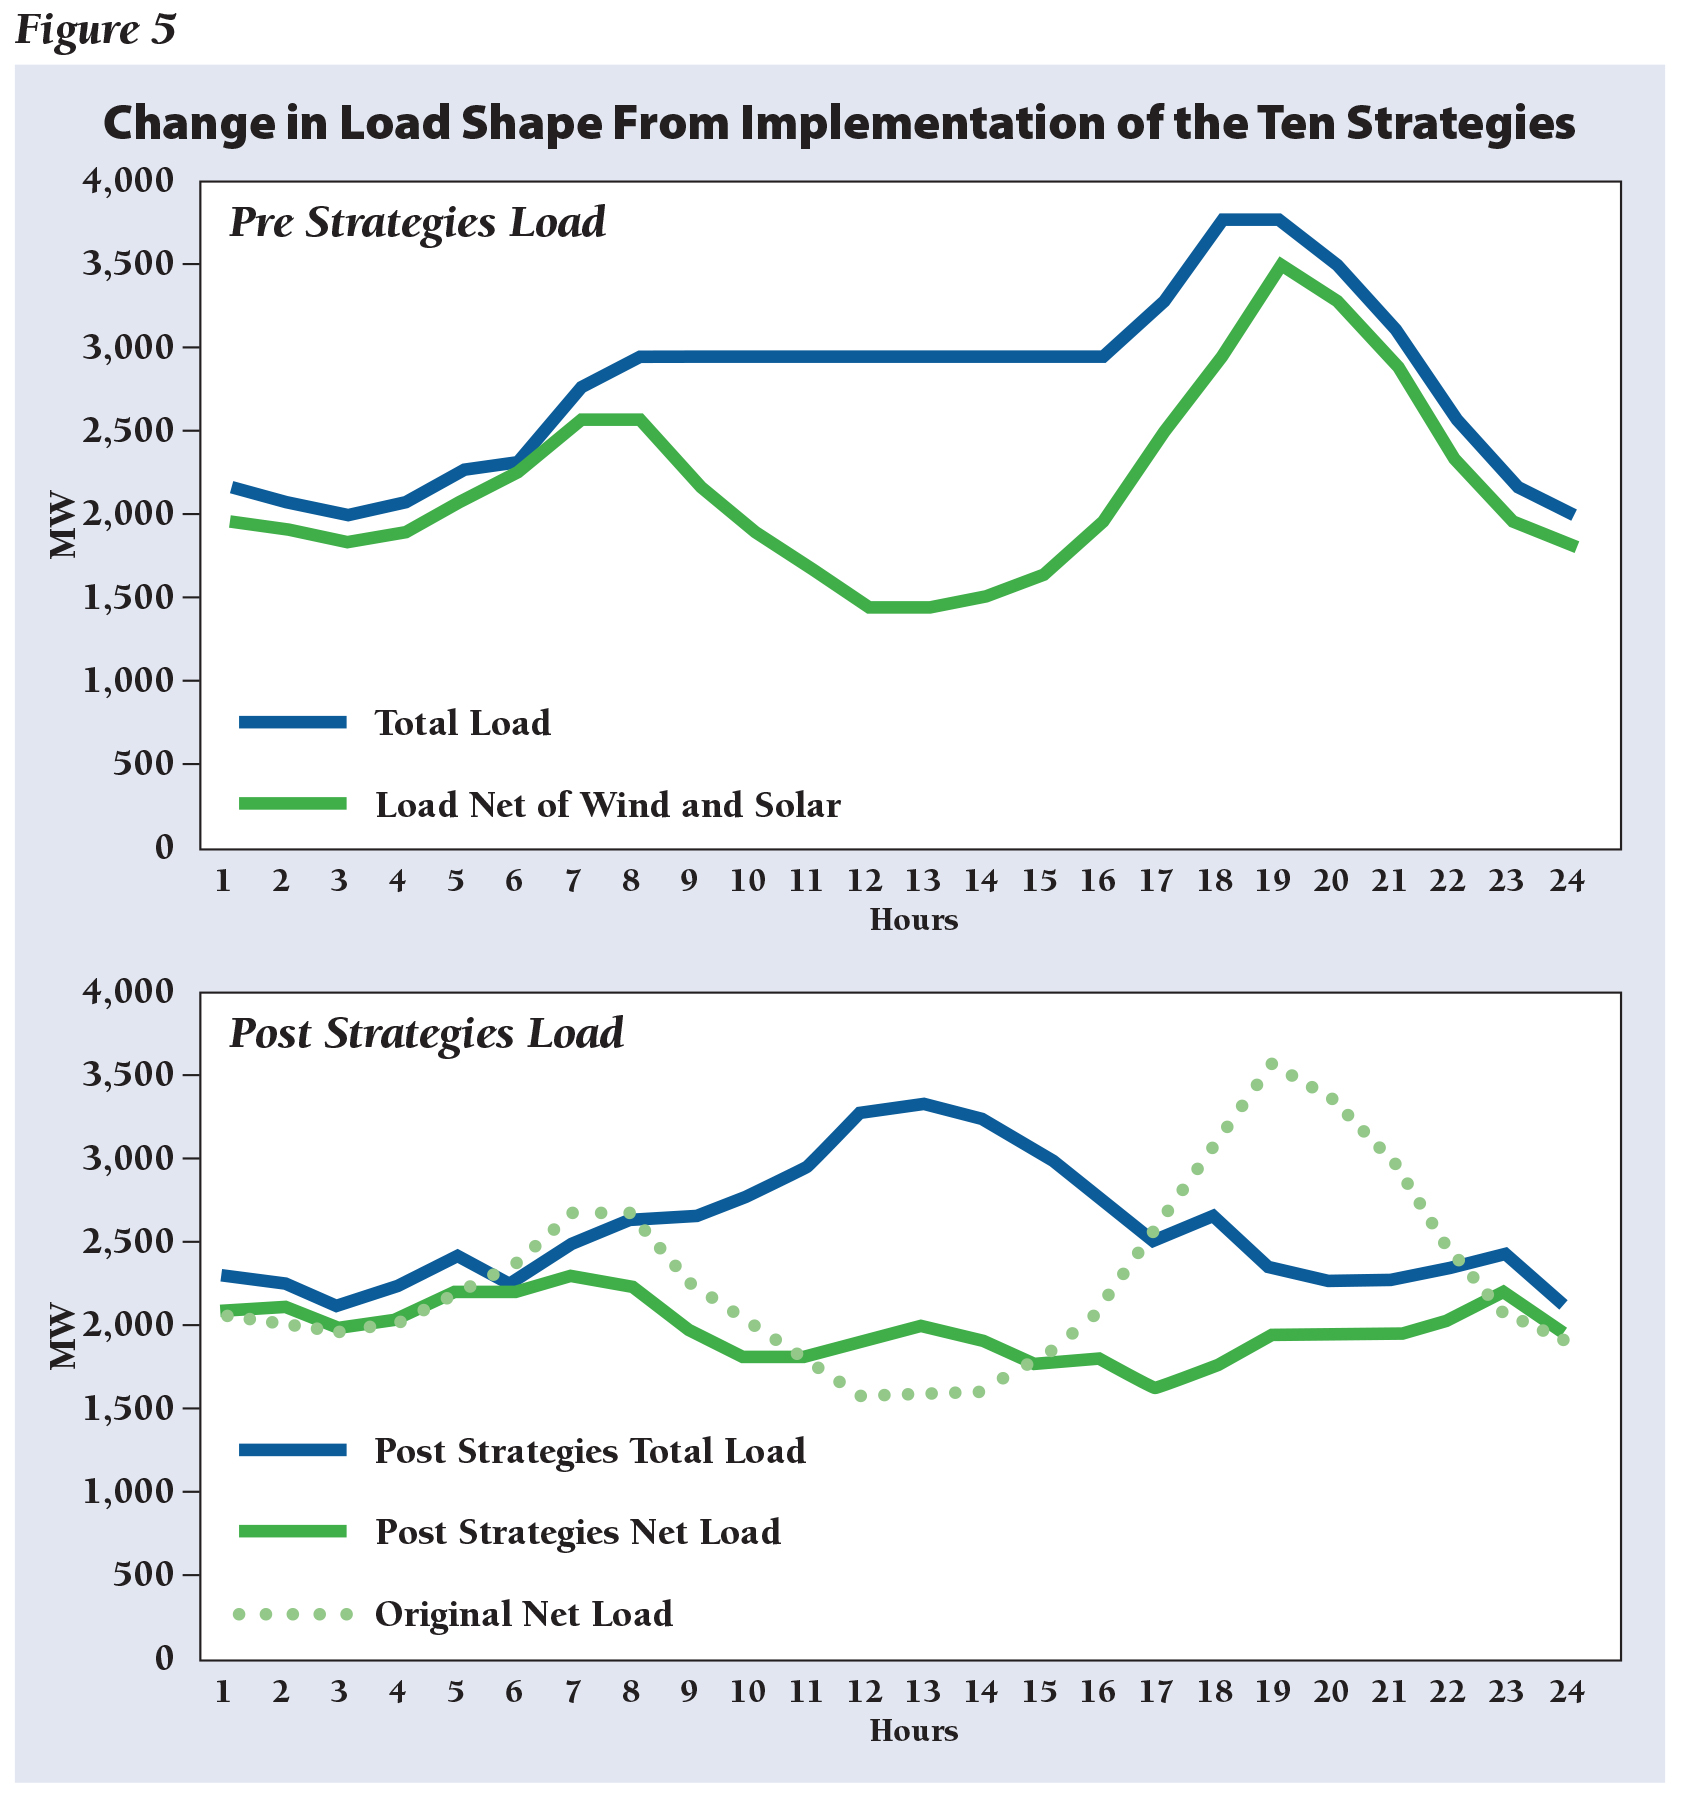
The strategies not only enable substantially greater renewable energy integration, they enhance system reliability and reduce generation, transmission, and distribution capital costs and fuel expense by modifying the load profiles and better utilizing existing assets. Not every strategy will be applicable to every region or utility around the country, and every region will have additional strategies that are not among these ten.
But the key takeaway? The duck curve, while it challenges us to be creative and innovative, is certainly not a threat to an affordable, reliable, and environmentally-friendly energy future.
This post originally appeared on Utility Dive. To view the original version, click here.