Content Filter:
储热:电供热发展的关键环节,电价机制如何优化配套?
近日,北京城市副中心的绿心公园通过了国内外两项碳中和认证,成为北京市首个“全域零碳公园”。其中,园区的供热系统采用分布式光伏+地源热泵+水储热模式,将绿电利用到极致。储热作为热泵的“好搭档”,在各地低碳、零碳园区也相继涌现。 View Summary +

分时电价向前迈步,动态尖峰电价贴近需求
随着中国能源需求的不断增长以及可再生能源的大规模并网,平衡能源供需的挑战将日益增长。在可再生能源主导的电力系统中,保障电力系统安全稳定经济运行面临着全新挑战。电力系统不仅需要满足静态的“迎峰度夏”和“迎峰度冬”中的高峰用电需求,更需要妥善处理日间净负荷波动对电网的影响。解决这些挑战的一个重要手段是拓宽现有思路,积极探索费率设计和需求侧管理等政策的迭代,制定能够反映电网供需变化的动态智能电价体系。 View Summary +
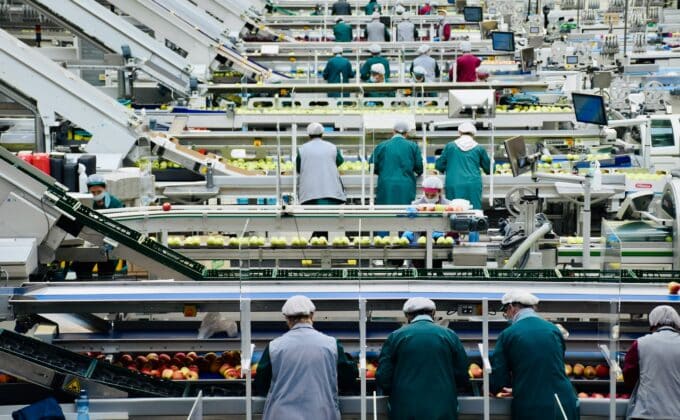
Light industry, an obvious place to reduce gas use
Building on the European Green Deal, the European Commission has adopted a new business plan for Europe – the Clean Industrial Deal. The plan aims to address the “climate crisis and its consequences, competitiveness concerns and economic resilience.” A… View Summary +
Why Am I Here? Looking at a Commission’s Role in the IRP Process
In most U.S. states, the utility commission has a formal role to play in reviewing or approving the contents of a utility’s integrated resource plan (IRP). These plans serve as long-term, forward-looking energy strategies that electric utilities use to meet their… View Summary +
现货市场是全国统一电力市场的基石
近日,国家发展改革委、国家能源局颁布了《关于全面加快电力现货市场建设工作的通知》(发改办体改〔2025〕394号)为现货市场加速发展制定了时间表,要求2025年底前基本实现电力现货市场全覆盖,全面开展连续结算运行。现货市场的建设实践至关重要,有望显著提升电力系统运行效率,更可有效促进可再生能源消纳。 View Summary +

推动建筑绿色发展,需超越电力比例,聚焦高效设备
2025年是中国“十四五”规划的收官之年,也是“十五五”规划谋篇布局的关键一年,中国将在这一年继续制定落实《巴黎协定》承诺的措施,并明确下一个“五年规划”的核心方向。在实现碳达峰、碳中和目标的过程中,建筑用能结构的转型已成为不可忽视的重要环节。 View Summary +

《推动热泵行业高质量发展行动方案》对智能调控和灵活运行的启示
2025年4月,国家发展改革委联合工业和信息化部、生态环境部、住房城乡建设部、交通运输部、国家能源局等部门发布了《推动热泵行业高质量发展行动方案》(发改环资〔2025〕313号)(以下简称《行动方案》)。《行动方案》提出,力争到2030年,热泵生产制造和技术研发能力不断增强,热泵建筑应用面积和热泵机组装机容量持续增长。 View Summary +

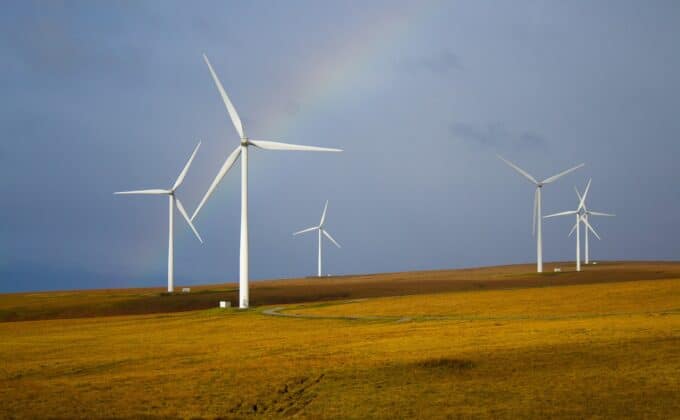
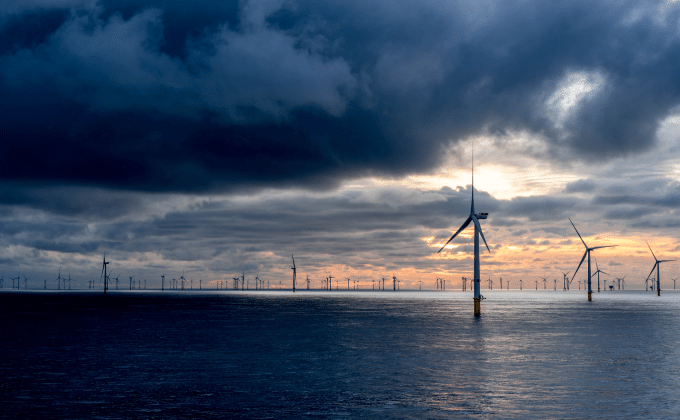
Holding on to Windy Hope: Offshore Wind’s Future Under the New Executive Order
With roughly 129 million Americans living along its coasts, the earth’s ocean has long played a crucial role in supporting economic and personal activities. One activity that coastal states have been particularly interested in is exploring offshore wind farms. View Summary +
Why wait for the next energy crisis? Enjoy the benefits of flexibility today
Europe has been paving the way to greater residential demand flexibility since 2018, and according to RAP’s recent survey, residential smart tariff offerings have increased by 250% since the energy crisis hit in 2022. Let’s look at how European… View Summary +
Making sense of China’s new heat pump strategy
This week, China’s central government issued a national ‘Action Plan’ to promote heat pumps. The policy offers substantial support for heat pumps but leaves critical questions unanswered—particularly regarding the future of certain types of fossil fuel… View Summary +